09 Sep
This post was written by: Kara Mehnert & Rachel Danto.
As marketers, we know the line between effective frequency and ad fatigue on Facebook is very thin. The Paid Social and Data Strategy teams here at Seer wanted to develop an analysis to showcase how often after seeing a client’s creative does click-through-rate begin to drop — without needing to rely on additional and expensive 3rd-party management or creative analysis platforms.
Forming a Hypothesis
Ad Fatigue
Across one of our client’s campaigns, we were seeing click-through-rate dropping week over week. After doing some further digging, we formed the hypothesis that higher frequencies were beginning to lead to decreased CTR. Therefore, we wanted to put a plan in place to ensure we refresh creative in a timely manner to avoid future problems of fatigue.
Once the paid social team knew the problem at hand, we collaborated with the data strategy team to find a solution for the creative fatigue issues. We had a few questions we wanted to answer:
- What is the median frequency by ad type, audience & creative?
- What is the median CTR by ad type, audience & creative?
- What is the median conversion volume by ad type, audience & creative?
The questions listed above are important to us as marketers because we want to ensure we aren’t showing our audience the same ad too many times.
Overexposure to an ad will cause an audience to lose interest which will result in the click-through-rate dipping and therefore causing conversions to decrease as well.
Power BI
From there, we pulled Facebook ad level performance data (week, Month, AND Lifetime for campaigns) to build a Power BI dashboard. These metrics included:
- Dates
- Campaign
- Ad Set (Audience)
- Ad
- Amount spent
- Frequency
- Link clicks
- Impressions
- Conversions
- CTR
Shown below is the frequency vs. CTR for all campaigns and timeframes. Among the data, there is a clear curve of diminishing return showing that once the frequency hits a certain point, the CTR will begin to dip.
NOTE: Bubble size reflects how many results were generated from that ad
We just built this awesome analysis that didn’t require any expensive third party tool — what do we do next? Using this analysis we can do the following things:
- Find which ads to turn off/refresh because they are over the ad fatigue limit that is set by account.
- Determine how often to refresh creatives for a specific ad set.
- Look at creative fatigue for different types of creatives (static vs. animated).
- Determine at what frequency do we begin to see CTR drop off.
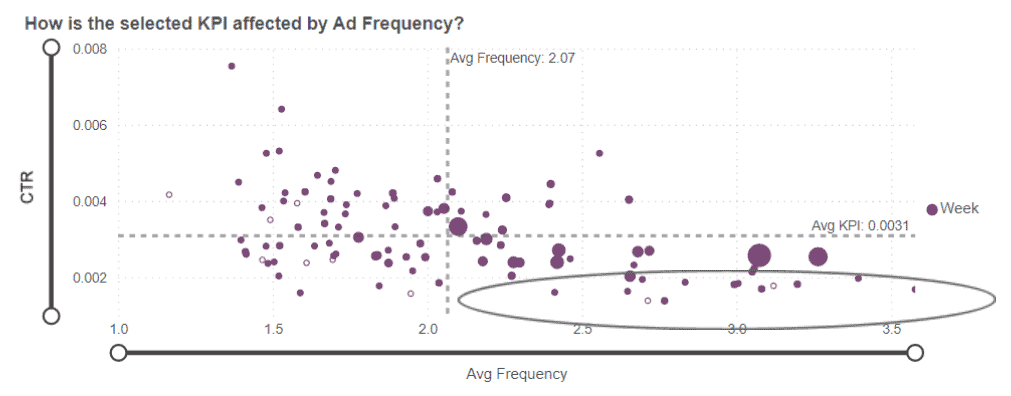
Average CTR vs Frequency
We analyzed the ad data at weekly, monthly, and lifetime timeframes to ensure we saw the entire picture. From there, we determined the median CTR and frequency for each timeframe and highlighted which ads we would recommend pausing/refreshing.
For example, below is the weekly CTR vs frequency dashboard for our client. We would recommend pausing/refreshing ads that have a small amount of results, are above the average of 2.07 frequency a week, and below the average of .31% CTR.

Top & Lowest Performers
The creative fatigue analysis can also be used to look at performance for a specific audience. For example, for our client we pulled the top and worst performers based on CTR vs. frequency.
Shown below is the audience with the highest frequency pulled by lifetime. This means that on average, a user saw the ad 35 times over the lifetime (8 months) and CTR was very low compared to the average of all campaigns.

Templatizing for Other Clients
The best part of this dashboard is that it can now be utilized across all clients, small or large, that are active on Facebook Ads. It is as simple as downloading the raw data and importing it into the Power BI file!
Don’t Miss a Thing
Our team is constantly coming out with new tools to visualize data and solve real-world problems for our clients. Learn more about other cool analyses like this in our upcoming webinar:

Sign up for the Seer Newsletter for more tips and tricks like this delivered to your inbox:
Source: www.seerinteractive.com, originally published on 2021-09-08 13:11:35

![How to Successfully Use Social Media: A Small Business Guide for Beginners [Infographic]](https://b2webstudios.com/storage/2023/02/How-to-Successfully-Use-Social-Media-A-Small-Business-Guide-85x70.jpg)


![How to Successfully Use Social Media: A Small Business Guide for Beginners [Infographic]](https://b2webstudios.com/storage/2023/02/How-to-Successfully-Use-Social-Media-A-Small-Business-Guide-300x169.jpg)

Recent Comments