02 Nov
TikTok Analytics: Account Dashboard
Once Pro Account is activated, you’ll find a new analytics button under your account options.
We suggest taking a look on desktop by tapping the upper right tab, and selecting “View Analytics.”
This is where TikTok shows you top-level data for the last 7 or 28 days, depending on which option you choose.
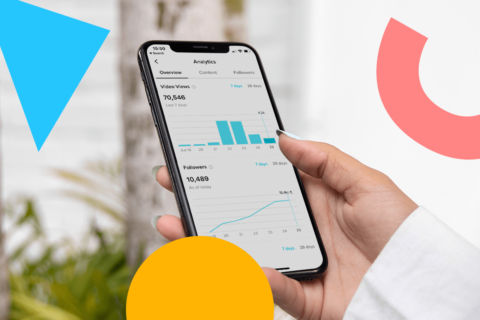
Once data starts populating, you can dive into your account insights. There are three main categories TikTok displays on your account dashboard: Overview, Content, and Followers.
Dashboard #1: Overview
Your TikTok Analytics Overview does exactly what it says on the tin: it gives a good overview of how your account is performing.
Here, you can see up to 28 days of data for:
-
Video Views
-
Follower Growth
-
Profile Views
Dashboard #2: Content
The “Content” tab opens up a flood of knowledge and insights at your fingertips.
On the Video Posts tab, you will see the top 9 videos (that you posted within 7 days) with the fastest growth in views.
If you didn’t post within 7 days, you’ll see an empty dashboard, encouraging you to post more.
On the Trending Videos tab, you’ll see which of your videos have been trending on the For You page (within this period) and the total number of views those videos have accumulated throughout.
Trending Video Views shows your top 9 videos with the fastest growth over the past 7 days. This gives great insights into what videos are trending now, even if they were published before the 7 day time frame.
This is a great place to see if you have any “slow burner” content.
Your TikTok videos can sometimes see a spike in views days, weeks, or even months after it’s posted, so don’t rule out every post as an immediate low-performer!
Dashboard #3: Followers
The last section is the Followers tab.
Here, you’ll see a breakdown of demographical data for your followers!
Follower count shows you how many total followers you have as of the 7-day reporting period and how many followers you’ve gained or lost week over the week.
Gender analytics show the total distribution of followers by their gender.
Top Territories shows where your followers are located by country as a percentage breakdown. This can help you understand whether you’re actually reaching the target audience for your brand.
Follower Activity shows your follower activity based on what time your followers are most active on the platform.
This is an incredibly helpful metric because not only does it showcase the hourly times on exact dates in which your audience is active and scrolling, but you can see the times your audience is the least active.
Understanding when your followers are most active is one of the best ways to discover your best time to post, which can be a great way to guarantee more interactions straight out of the gate.
Once you see the times that are the best, try uploading during those most active times.
NOTE: TikTok showcases data across all accounts as UTC timing, so keep that in mind when you’re reviewing.
Want to learn more about how to find your best time to post on TikTok? We have a whole blog post dedicated to doing just that! Check it out here.
Source: later.com, originally published on 2021-08-26 16:40:57

![How to Successfully Use Social Media: A Small Business Guide for Beginners [Infographic]](https://b2webstudios.com/storage/2023/02/How-to-Successfully-Use-Social-Media-A-Small-Business-Guide-85x70.jpg)


![How to Successfully Use Social Media: A Small Business Guide for Beginners [Infographic]](https://b2webstudios.com/storage/2023/02/How-to-Successfully-Use-Social-Media-A-Small-Business-Guide-300x169.jpg)


Recent Comments