09 Sep
How to Use Later’s Instagram Industry Benchmarks Report to Inform Your Instagram Strategy
Metrics matter on Instagram — they tell you whether you’re on the right track or not.
But what qualifies as a “good ” engagement or reach rate, and how do they differ from industry to industry?
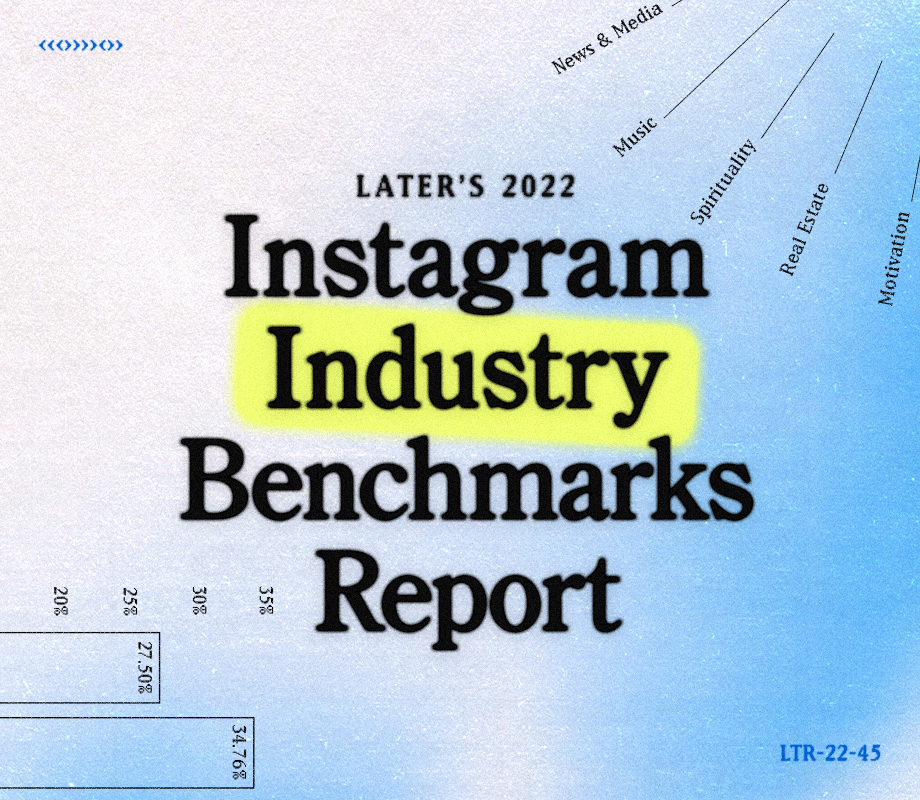
Enter: Later’s Instagram Industry Benchmarks Report.
By analyzing over 63M posts, we calculated the average reach and engagement rates for top 30 industries, split by follower category — so you can accurately benchmark your brand or business and set realistic goals.
Once you’ve got your goals locked in, you can use Later’s Instagram Analytics to closely measure how your posts are performing — all in an easy-to-use dashboard.
Later’s Instagram Analytics lets you track up to 12 months’ worth of Instagram feed posts and stories, so you can see exactly what’s performed best and filter by key metrics, such as engagement rate, reach, likes, comments, and more.
It’s the easiest way to get a visual overview of what posts are performing best for your account, so you can tailor your strategy for the best results.
Plus, it’s all available from the comfort of your desktop screen — and you can export all your key Instagram metrics as a CSV file in one click.
Goodbye, copy and pasting stats from your Instagram app!
When it comes to improving your marketing strategy, tracking your metrics is a no-brainer.
By understanding what motivates your audience through Instagram analytics tools, you can better tailor your content for a boost in reach, engagement, and growth on the platform!
Discover the average Instagram reach and engagement rate benchmarks for 30 top industries. Download Later’s free 2022 industry benchmarks report now:
Source: later.com, originally published on 2022-04-28 06:21:15

![How to Successfully Use Social Media: A Small Business Guide for Beginners [Infographic]](https://b2webstudios.com/storage/2023/02/How-to-Successfully-Use-Social-Media-A-Small-Business-Guide-85x70.jpg)


![How to Successfully Use Social Media: A Small Business Guide for Beginners [Infographic]](https://b2webstudios.com/storage/2023/02/How-to-Successfully-Use-Social-Media-A-Small-Business-Guide-300x169.jpg)


Recent Comments