

Google Analytics is a free reporting tool for monitoring visitor traffic to a website or app and spotting sales or marketing opportunities based on visitor behavior or demographics. Having a complete understanding of web or app traffic helps to ensure that you are spending your media budget efficiently and gives actionable information about what is – and what is not – working as expected.
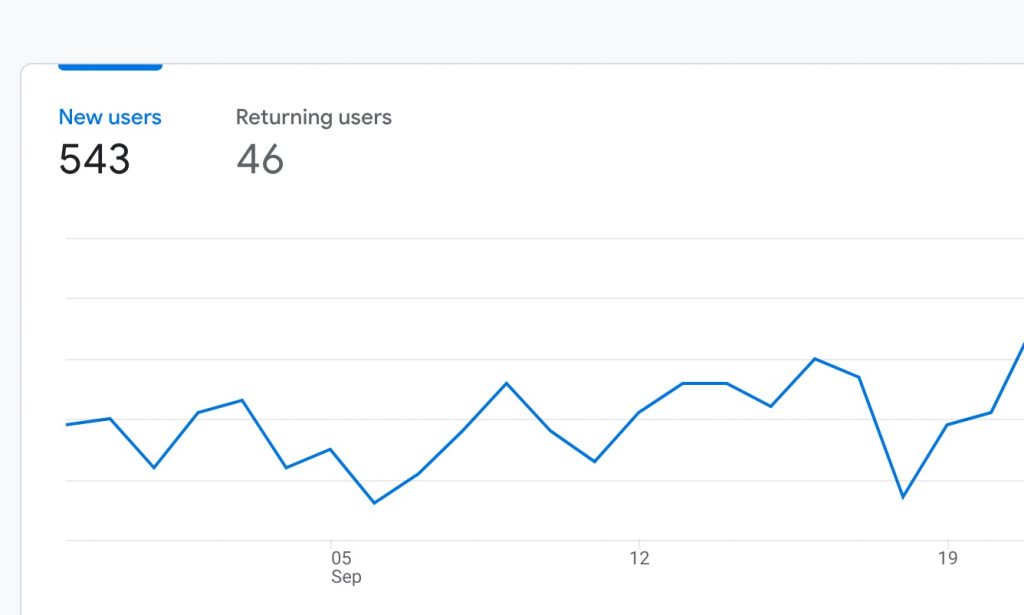
For example, a sudden jump in new visitors may indicate that an advertising campaign is successfully drawing traffic to your site. Similarly, a steady increase in repeat visits tells us that your customers are engaging with your content, keeping your brand top-of-mind.
In order for Google Analytics to work, we add a special tracking code to each of your web pages for Google to collect a variety of user insights to determine potential improvements to your marketing efforts.
The most important reports to monitor in Google Analytics are:
PAGEVIEWS AND UNIQUE PAGEVIEWS
A pageview is a measurement of the number of times a page is loaded. This does not always indicate different visitors – if a user refreshes the page they’re on, this counts as a new pageview. If the same user clicks to another page and then returns, this also results in an additional pageview. Unique pageviews, on the other hand, are separate visits to your site, where that page is opened one or more times. A summary of your recent pageviews is displayed on the main Google Analytics dashboard page, and can also be found in the “Content Overview” section.
VISITS, VISITORS AND CLICKS
“Visits” are the equivalent of browser sessions. A visit ends when the browser closes or goes inactive for more than thirty minutes. Google Analytics may show visit numbers that differ from the number of clicks in your Google Ads reports. One reason for this is comparison shoppers who click an ad multiple times in the same browser session resulting in multiple clicks, but only one visit.
A “Visitor” may represent several sessions each with multiple pageviews to several pages. The “Total Visitors” metric equals the number of different people who have seen your site. It counts each visitor only once by intelligently assigning a unique ID to their device(s) – first-time visitors get randomly generated IDs with timestamps appended to distinguish them as repeat traffic when they come back.
BOUNCE RATE / ENGAGEMENT RATE
This is the percentage of visitors that leave a webpage without taking an action, such as clicking on a link, filling out a form, or making a purchase. Average bounce rates range from 40% to 50%, but it depends heavily on your industry and where your traffic comes from. A high bounce rate lets you know that your visitors aren’t staying on your pages, which could be occurring for a variety of reasons.
EXIT RATE
Exit Rate is similar to Bounce Rate, with one major difference: Bounce Rate is the percentage of people that land on a page and leave. Exit Rate is the percentage of people that leave a specific page (even if they didn’t initially land on that page). For example, let’s say someone lands on Page A from your site. And they hit their browser’s back button a few seconds later. That’s a bounce.
On the other hand, let’s say someone lands on Page A from your site. Then, they click over to Page B. Then, after reading Page B they close their browser. That person clicked on something on Page A, so that doesn’t equate to a bounce on Page A. And, they didn’t initially land on Page B, so it’s not a bounce on Page B either. Because the visitor left your site from Page B, Page B’s Exit Rate increases in Google Analytics.
So, if you notice a page on your site with a super high Exit Rate, that’s a problem worth fixing.
EVALUATING VISITS AND VISITORS
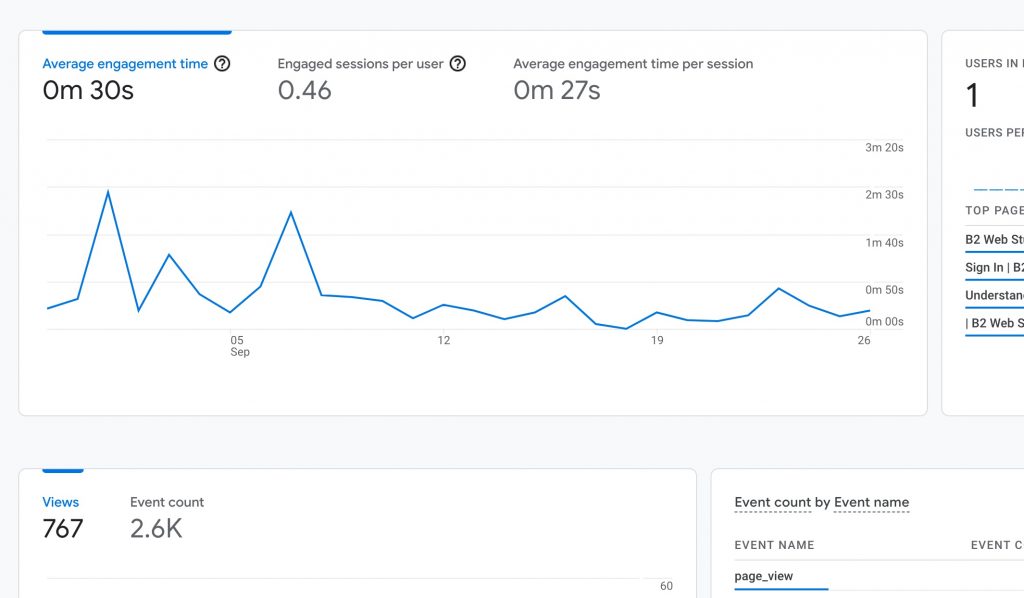
Google Analytics allows for setting up advanced “E-Commerce” segments to measure revenue from new customers using their average transaction value and number of transactions. Similarly, advanced segments in the “Location” report can examine where your customers are (geographically), and the “Engagement” report displays how much time users spent on your website and how long they stayed on individual pages.
The frequency and recency report measures how many times visitors came back to your site, and how often. Combining this with “All Visits” or “Visits with Transactions” shows whether you sell primarily sell to new or repeat customers.
“Visit Duration” – located in the Engagement report under Behavior – shows whether the overall visit time is being skewed by a few long visits to certain pages of your website.
Time on Page measures engagement by comparing the pageview’s timestamp with that of the following pageview. If the viewer exits the site from this page, its time on site for the user will be zero, since there is no subsequent time stamp. Average time on page is the total time spent by all visitors, divided by the page’s unique visits for the selected date range.
TRAFFIC SOURCES
Knowing where your customers originate is key in measuring ROI and the effectiveness of marketing campaigns.
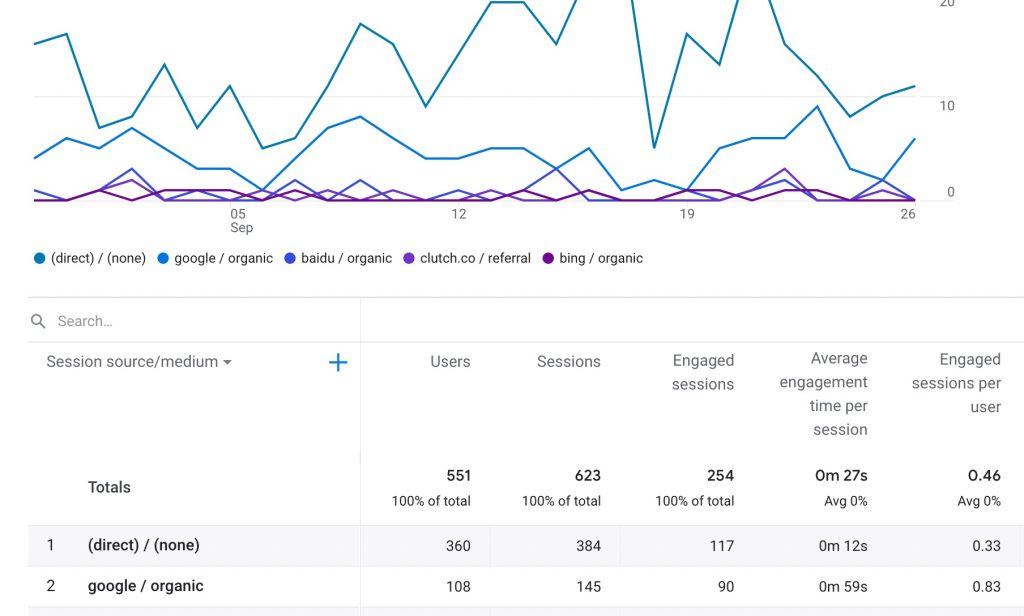
A “Referral” tells which website or platform sent traffic to you. Traffic may come from a Google search, a link in a marketing email, a promoted post on Facebook, or an affiliate website. The ‘All Traffic’ report will break down your visitors by referring site and shows for each site:
- Number of visits
- Pages per visit
- Average time on site
- The percentage of new visits
- Bounce rate
Search Engines statistics reflect organic or pay-per-click traffic from all search engines. Direct Traffic measures visits from bookmarks, URLs typed directly into the browser’s address bar or traffic that has lost its referral along the way.
Of course, you’ll be interested in traffic sources that send you the most visitors. However, the volume of visitors is only one dimension to consider when evaluating your traffic sources. The quality of referral traffic is also important.
Having E-Commerce or Goal Sets configured in Google Analytics provides many additional insights on the traffic sources driving your sales. For example, you can compare sales revenue for visitors by a source to average revenue.
To find the keywords customers use to find your site, click ‘Incoming Sources’ in the Traffic Sources menu, then Search Overview. Now select Keyword. If particular keywords have a high bounce rate, users who looked at a page briefly then left the site, viewers may not see what they expected. It’s possible that the page they’re landing on from a particular keyword does not seem relevant. Drill down the keywords to see the page with bounces. If there’s a high bounce rate, update your page content to send that keyword’s traffic to a better result.
This tab can also tell you where your conversions came from. But Google Analytics assumes that the most recent ad the user clicked caused the sale or conversion that followed. This matters in measuring the effectiveness of different ads and is referred to as “attribution”, So:
- A click on an Adwords ad followed by a purchase credits to the Adwords ad.
- If the user arrives from an Adwords ad, then returns later from a bookmark, the Adwords ad still gets credit for the conversion.
- However, if the user clicks on an ad then later returns from a search engine or some other link, that source will be credited with the conversion.
If this doesn’t work for your business and you want to override this behavior, append utm_nooverride=1 to all referral links. This will ensure that your google analytics reports give credit only to the original referral source for the sale.
CONTENT REPORTS
The Pages report and the Content Drilldown report compile traffic details for your pages by page and directory respectively. The Navigation Summary tab of the Pages report shows how visitors came to each page and where they went afterward. The figures are expressed as a percentage of total page visitors.
- Exits measures how often visitors left the site from the page.
- Entrances are pageviews where users arrived through the page.
- Previous Pages reflects users who came to the page from another page in the site.
- Next Pages are pageviews that are followed by a pageview of another page.
The Landing Pages report lists pages through which visitors arrived at your site and gives their bounce rates. If the bounce rates are too high, you may want to tailor them more closely to their referral links and advertising.
The Entrance Paths tab shows how your visitors navigated from the landing page. Click the link for a landing page. The left column shows a list of all clicks on the page. Choose the purchase page link. The right column lists pages your visitors went to from the purchase page. The number who ended up on the purchase completion page is a metric that may tell you whether your purchase page is doing what you want it to. Or, if users are leaving on some intermediate step, like entering shipping information, you may need to provide better instructions to help guide your customers through their transactions.
![How to Successfully Use Social Media: A Small Business Guide for Beginners [Infographic]](https://b2webstudios.com/storage/2023/02/How-to-Successfully-Use-Social-Media-A-Small-Business-Guide-300x169.jpg)